




A high return rate is not inherently problematic, and generic industry benchmarks cannot accurately diagnose your performance. Fundamentally, returns represent three behaviours added together: bracketing, disappointment and habitual. These all land in the same percentage, and each one means something completely different for your business. Once isolated, the core commercial question becomes entirely answerable
Both strategic readings of returns are defensible, and the following analysis argues each at full strength. Treating returns as a strict operational cost to be reduced is the winning strategy for certain models. Conversely, treating them as an acquired asset, something you have already paid for, wins in others. Finally, this piece details which lever a premium brand should deploy last, and explores why the majority of the UK luxury sector already agrees.
What a return rate benchmark can and cannot tell you
A benchmark tells you if your return rate looks like everyone else’s in your sector. Matching the industry average tells you what is common; it does not tell you if you have a fundamental commercial problem.
Those two only coincide at the extremes. A 5% rate on womenswear or a 60% rate each tell you something without anything to compare against.
The middle is where they come apart, and the middle is crowded. Retail Economics and ZigZag put UK non-food returns at £25.1bn for 2025, down from £26.7bn, with the rate easing from 21% to 19.5%.
Report anywhere near that and you have learned one thing. You are ordinary, and ordinary is not the same as fine.
Where return rate benchmarks come from
Companies selling returns software, reverse logistics and 3PL services publish them.
Their research is often solid and their method is often stated. It is still commissioned by people whose product exists to bring the number down.
Read the byline before you trust the figure.
Your return rate is three different behaviours added together
Three behaviours produce a return, and each fix makes another one worse.
Bracketing is the customer who orders three sizes intending to keep one. This is a fulfilment cost incurred on a customer who bought, and it is the cheapest return you can have, because the sale already happened.
Disappointment is the product failing to match what the photography, the description or the size guide implied. That costs you the sale and the processing on top, and it predicts whether the customer orders again.
Habitual returning is a cohort using returns as a shopping method. Retail Economics sorts consumers into occasional, efficient, slow and serial returners, and finds Gen Z most heavily represented in the difficult groups, with 23% identifying as slow returners and 10% as serial.
Watch what happens when you treat all three as one number. Charge for returns and you suppress bracketing, which was the cheap kind, while making disappointment more expensive for a customer who was already disappointed. Narrow the size range and you cut bracketing along with the fit insurance that made the first order possible. Every lever you have touches all three at once. You cannot tell whether you have won until you know which one you were aiming at.
Why two brands selling the same product report different return rates
Part of your return rate is who your customers are, and none of that is visible in a category average.
Two menswear brands can run identical product, sizing and photography, and still post different return rates on customer age mix alone. If one skews 28 and the other 52, the younger brand sees more bracketing and habitual returning before anybody has made an operational mistake. No benchmark controls for that.
This is the part you can see from the marketing side. Start there. Break your return rate down by acquisition source, by campaign, by discount depth and by new against returning customer. Where the picture comes back uneven, you own both the data and the lever.
The case for treating returns as a cost to reduce
This case is strong, and it wins outright in three situations.
When disappointment is what produces the rate, every return is a sale you lost and paid to lose. When recovery is broken, and the unit comes back unsellable or fit only for liquidation, the return destroys margin instead of delaying it. And when the high-returning cohort never converts into profitable repeat purchase, you are funding a shopping habit that does not pay you back.
None of that is answerable from your ad account. Five questions settle it, and they belong to finance and operations:
- What does one return cost end to end, including the shipping leg, inspection, refurbishment and restocking?
- What share comes back sellable at full price, and what share only moves at markdown?
- How long is the unit unavailable between despatch and being resellable?
- What share is written off or liquidated, and at what recovery against cost?
- What does the returns process cost you in warehouse labour during peak?
Get those five answers and the argument stops being philosophical, because a unit that recovers most of its value quickly strengthens the case below, while a unit that recovers little settles the question here.
The case for treating returns as something you paid for
The reduce-it instinct wins arguments it should sometimes lose, because the cost is hidden in someone else's numbers.
A lenient returns policy buys purchases, and the bill for tightening it does not arrive in logistics.
The academic evidence here beats anything in the benchmark literature. A meta-analysis of 21 studies in the Journal of Retailing found that leniency raises purchases more than it raises returns, which is the commercial case in a single finding.
UK consumer data points the same way. Retail Economics found six in ten Millennials have abandoned a purchase over an unsatisfactory returns policy, against 49% of shoppers overall. That is a conversion loss, and it never shows up in a returns report.
Tighten the policy and your return rate falls, which looks like a win in the one place everybody is measuring. Conversion falls at the same time, and the cost reappears as a worse cost per acquired customer, in a different report, owned by a different team, attributed to media performance. The saving is visible. The cost is hidden in somebody else's numbers, which is how the reduce-it instinct wins arguments it should sometimes lose.
Should you charge for returns?
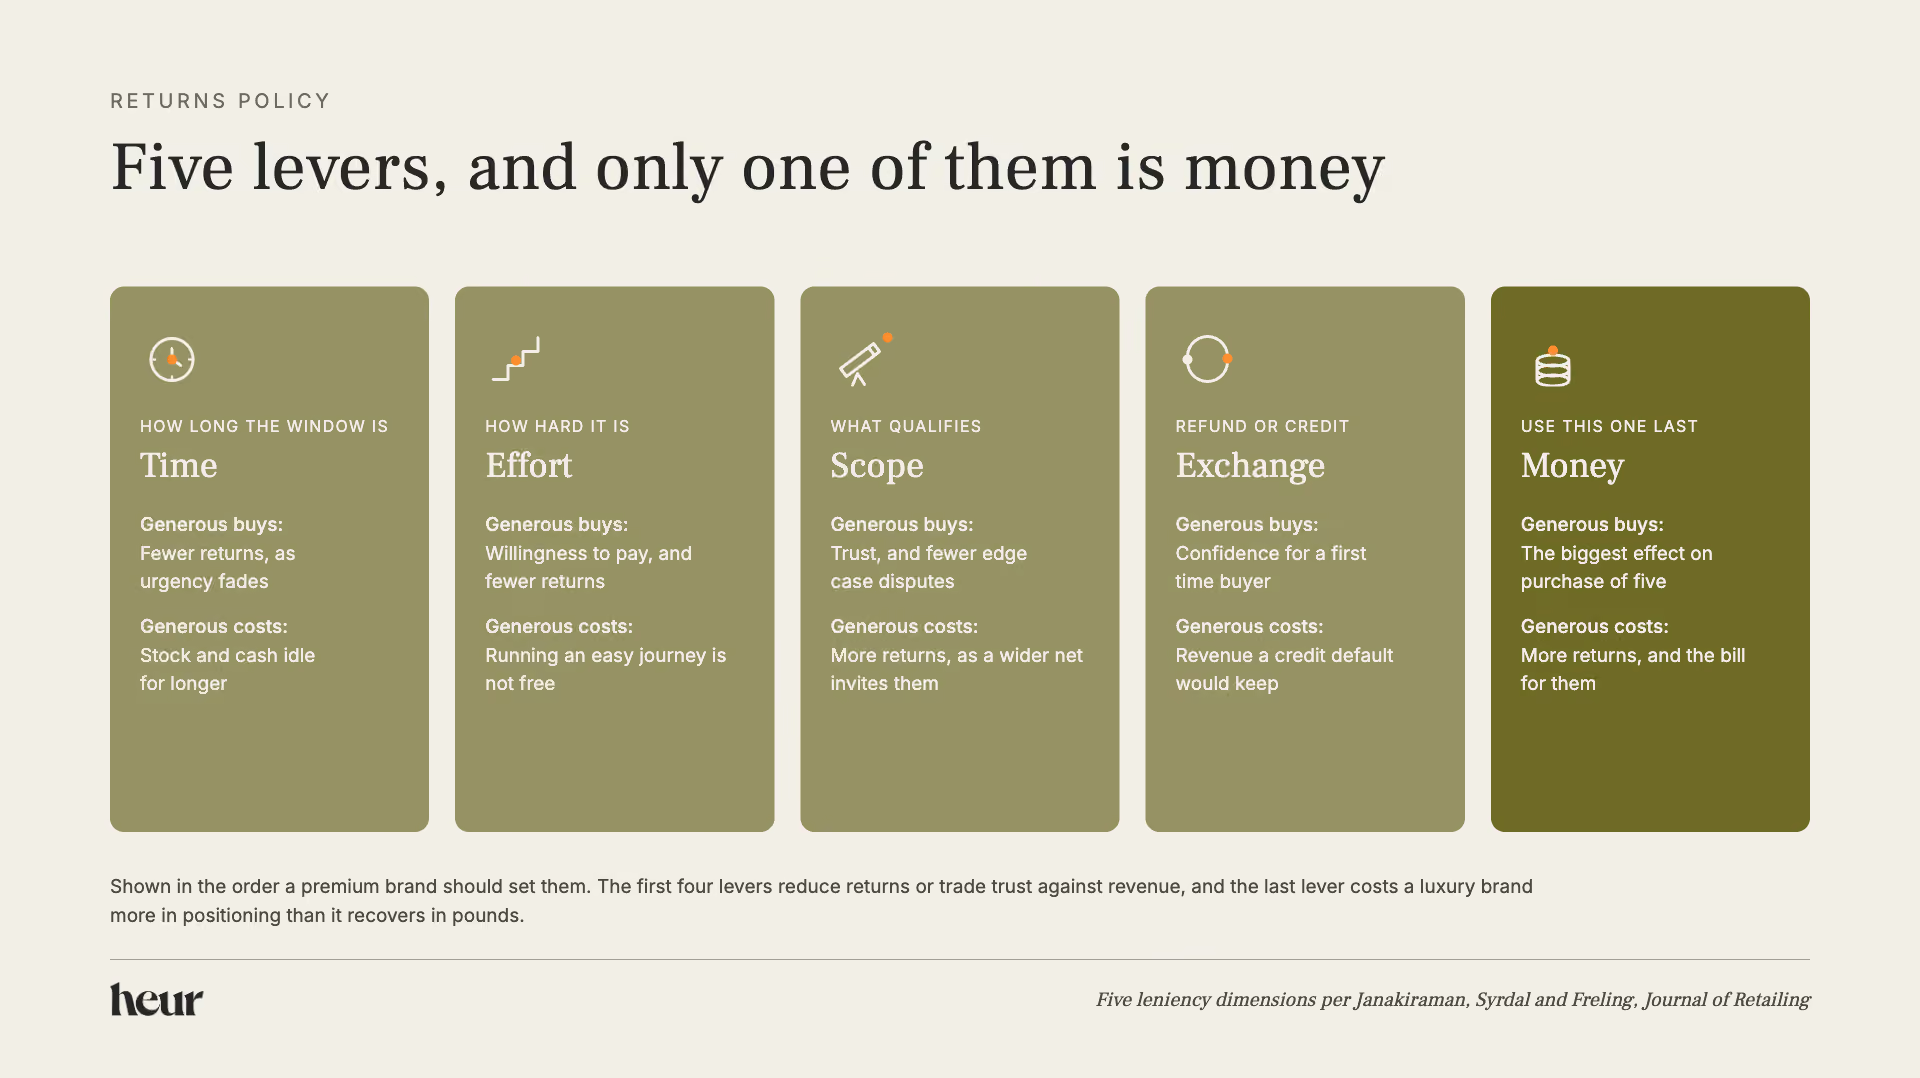
Charging is one lever of five, and a premium brand should use it last.
The returns research separates policy leniency into five dimensions, and they do not all point the same way. Monetary leniency moves purchases hardest and lifts returns along with them, while leniency in time and effort does less for purchases and brings returns down.
Should you charge for returns?
The UK market has already sorted itself, and it sorted by price point. Across 100 benchmarked clothing and footwear retailers, 42% charge for returns, while the luxury sector is at 11% and young fashion at 80%. Only 24 of the 100 offer returns that are free in every sense. Identical mechanics, opposite answers, because a return fee costs a luxury brand more in positioning than it recovers in pounds and costs a young fashion brand very little of either.
So the verdict is not a number. The decision belongs to your P&L and your brand position, and what you are choosing is a lever rather than a target. For a premium or luxury brand, money is the lever you use last, once time, effort, scope and exchange have all been set deliberately. Most of your competitive set worked that out already.
Common questions about ecommerce return rates
What is a good return rate for ecommerce?
There is no single answer, and your own history is the better comparison. UK non-food returns run near 19.5% overall, with clothing and footwear higher. Treat anything inside your category's range as unremarkable, and judge it on what a returned unit recovers and what your policy buys you at the till.
Should I charge for returns?
It depends on your price point, and the UK market shows the pattern clearly. Around 11% of luxury retailers charge for returns against 80% of young fashion retailers. If you sell at premium prices, a fee costs you more in positioning and conversion than it recovers, so set your time, effort, scope and exchange levers first.
Do free returns increase sales?
The evidence says yes, and by more than they increase returns. A meta-analysis of 21 studies found leniency raises purchases more than returns. UK data agrees: six in ten Millennials report abandoning a purchase because the returns policy was unsatisfactory, against 49% of shoppers overall.
Why is my return rate higher than my competitors'?
Often because your customers are different, not your product. Younger customer bases generate more bracketing and habitual returning at identical product quality, and no benchmark controls for customer age. Split your rate by acquisition source and cohort before assuming the difference is operational.
What to do first
Split the number before you touch the policy. Break it down by acquisition source, by discount depth and by new against returning customer, then separately by SKU, so you can see whether ten products are carrying the whole figure. Take the five recovery questions to whoever owns your warehouse costs. Within a fortnight you will be choosing a lever.
If those five questions stopped you, because nobody in your business owns all five answers, that is worth more attention than the percentage is. Splitting the rate is an afternoon's work in data you already have. Getting finance, operations and marketing to agree which number governs the decision is the harder conversation, and it is where we tend to earn our keep.